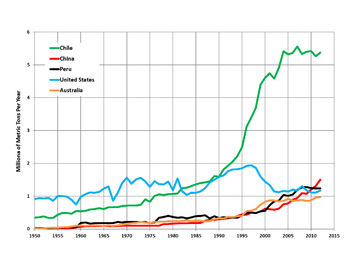
قائمة البلدان حسب انتاج مناجم النحاس
(تم التحويل من List of countries by copper mine production)
هذه قائمة البلدان حسب مناجم النحاس وتعتمد القائمة على معلومات هيئة المساحة الجيولوجية في المملكة المتحدة.
. . . . . . . . . . . . . . . . . . . . . . . . . . . . . . . . . . . . . . . . . . . . . . . . . . . . . . . . . . . . . . . . . . . . . . . . . . . . . . . . . . . . . . . . . . . . . . . . . . . . . . . . . . . . . . . . . . . . . . . . . . . . . . . . . . . . . . . . . . . . . . . . . . . . . . . . . . . . . . . . . . . . . . . .
2017
| Rank | Country/region | Production (thousand tons of) |
|---|---|---|
| World | 19,700 | |
| 1 | Chile | 5,330 |
| 2 | Peru | 2,390 |
| 3 | China | 1,860 |
| 4 | United States | 1,270 |
| 5 | Australia | 920 |
| 6 | Congo, Democratic Republic of the | 850 |
| 7 | Zambia | 755 |
| 8 | Mexico | 755 |
| 9 | Russia | 650 |
| 10 | Canada | 620 |
2015
| Rank | Country/region | Production (thousand tons) |
|---|---|---|
| World | 19,100 | |
| 1 | Chile | 5,760 |
| 2 | China | 1,710 |
| 3 | Peru | 1,700 |
| 4 | United States | 1,380 |
| 5 | Congo, Democratic Republic of the | 1,020 |
| 6 | Australia | 971 |
| 7 | Russia | 732 |
| 8 | Zambia | 712 |
| 9 | Canada | 697 |
| 10 | Mexico | 594 |
| Other Countries | 3,800 |
2012
1907
| Rank | Country/region | Production (thousand tons) |
|---|---|---|
| World | 723 | |
| 1 | United States | 399 |
| 2 | Mexico | 61 |
| 3 | Spain and Portugal | 50 |
| 4 | Japan | 50 |
| 5 | Australasia | 42 |
| 6 | Chile | 27 |
| 7 | Germany | 21 |
| 8 | Russia | 15 |
المصادر
- ^ Kay, Amanda (15 فبراير 2018). "Top Copper Production by Country". Copper Investing News. Retrieved 29 يونيو 2018.
- ^ USGS Minerals Information: Copper, USGS, 2017, https://minerals.usgs.gov/minerals/pubs/commodity/copper/index.html#mcs, retrieved on 28 March 2017
- ^ Encyclopædia Britannica, 11th ed. (1910), vol. 7, p. 109 - Copper. Production.—
