الانتخابات الرئاسية الأمريكية 2008
الانتخابات الرئاسية الأمريكية 2008، هي الإنتخابات الرئاسية رقم 56 في الولايات المتحدة الأمريكية. عقدت في 4 نوفمبر 2008. وفاز بها بارك اوباما مرشح الحزب الديمقراطي، بعد هزيمته للجمهوري جون مكين. حصل اوباما عل 365 صوت، مقابل 173 صوت لمكين.
| |||||||||||||||||||||||||||||
| |||||||||||||||||||||||||||||
 Presidential election results map. Blue denotes states/districts won by Obama/Biden, and Red denotes those won by McCain/Palin. Numbers indicate electoral votes allotted to the winner of each state. Obama won one electoral vote (from Nebraska's 2nd congressional district) of Nebraska's five. | |||||||||||||||||||||||||||||
| |||||||||||||||||||||||||||||


. . . . . . . . . . . . . . . . . . . . . . . . . . . . . . . . . . . . . . . . . . . . . . . . . . . . . . . . . . . . . . . . . . . . . . . . . . . . . . . . . . . . . . . . . . . . . . . . . . . . . . . . . . . . . . . . . . . . . . . . . . . . . . . . . . . . . . . . . . . . . . . . . . . . . . . . . . . . . . . . . . . . . . . .
خلفية
الترشيحات
مرشحو الحزب الديمقراطي
المرشحون
- باراك اوباما، سناتور من إلينوي
- هيلاري كلينتون، سناتور من نيويورك
- John Edwards, former U.S. Senator from كارولينا الشمالية
- Bill Richardson, Governor of نيو مكسيكو
- Dennis Kucinich, U.S. Representative from Ohio
- Joe Biden, U.S. Senator from Delaware
- Mike Gravel، سناتور سابق من آلاسكا
- Christopher Doddسناتور من كونيكتيكت
- Tom Vilsack، الحكام السابق لولاية إيوا
- Evan Bayh، سناتور من إنديانا
- Stephen Colbert، من نيويورك نيويورك
Senator Hillary Rodham Clinton of New York (campaign)

Former Senator John Edwards of كارولينا الشمالية (campaign)

Former Senator Mike Gravel of Alaska (campaign)

Former Governor Tom Vilsack of Iowa (campaign)

Comedian Stephen Colbert of نيويورك (campaign)


مرشحو الحزب الجمهوري
المرشحون
- جون مكين، سناتور من أريزونا
- Mike Huckabeeالحاكم السابق لولاية أركنساس
- Mitt Romney، الحاكم السابق لولاية مساتشوستس
- Ron Paul، عضو مجلس نواب من تكساس
- Fred Thompson، سناتور سابق من تنيسي
- Duncan Hunter، عضو مجلس نواب من كاليفورنيا
- Rudy Giuliani، عمدة سابق لمدينة نيويورك
- Alan Keyes, former U.S. ECOSOC Ambassador from ماريلاند
- Tom Tancredo، عضو مجلس نواب من كولورادو
- Sam Brownback، سناتور من كنساس
- Tommy Thompsonحاكم سابق لولاية ويسكنسن
- Jim Gilmore، حاكم سابق لولاية ڤيرجينيا

Former Governor Mike Huckabee of Arkansas (campaign)

Former Governor Mitt Romney of مساتشوستس (campaign)
Former Senator Fred Thompson of تنسي (campaign)

Former Mayor Rudy Giuliani of New York (campaign)

Former U.S. ECOSOC Ambassador Alan Keyes of مريلاند (campaign)

Former Governor Jim Gilmore of ڤرجينيا (campaign)


معرض صور المرشحين

Attorney Ralph Nader of Connecticut (campaign)

Former Representative Bob Barr of Georgia (campaign)

Former Pastor Chuck Baldwin of فلوريدا (campaign)

Former Representative Cynthia McKinney of Georgia (campaign)


تحالفات الحزب

- April 23–26, 2008: 2008 Constitution Party National Convention held in Kansas City, Missouri.
- May 23–26, 2008: 2008 Libertarian National Convention, held in Denver, Colorado.
- July 10–13, 2008: 2008 Green Party National Convention, held in Chicago, Illinois.
- August 25–28, 2008: 2008 Democratic National Convention, held in Denver, Colorado.
- September 1–4, 2008: 2008 Republican National Convention, held in Saint Paul, Minnesota.
الحملات الانتخابية

قضايا
العراق
عدم شعبية بوش
. . . . . . . . . . . . . . . . . . . . . . . . . . . . . . . . . . . . . . . . . . . . . . . . . . . . . . . . . . . . . . . . . . . . . . . . . . . . . . . . . . . . . . . . . . . . . . . . . . . . . . . . . . . . . . . . . . . . . . . . . . . . . . . . . . . . . . . . . . . . . . . . . . . . . . . . . . . . . . . . . . . . . . . .
التغيير مقابل الخبرة

الاقتصاد
جدل
تكلفة الحملات
الحملات على الإنترنت
ملخص التكلفة
| المرشح (الحزب) | المبلغ المخصص | المبلغ الذي تم إنفاقه | الأصوات | المتوسط لكل صوت |
|---|---|---|---|---|
| Barack Obama (د) | $532,946,511 | $513,557,218 | 69,498,215 | $7.39 |
| John McCain (ج) | $379,006,485 | $346,666,422 | 59,948,240 | $5.78 |
| Ralph Nader (I) | $4,496,180 | $4,187,628 | 738,720 | $5.67 |
| Bob Barr (ل) | $1,383,681 | $1,345,202 | 523,713 | $2.57 |
| Chuck Baldwin (م) | $261,673 | $234,309 | 199,437 | $1.17 |
| Cynthia McKinney (خ) | $240,130 | $238,968 | 161,680 | $1.48 |
| Excludes spending by independent expenditure concerns. Source: Federal Election Commission[2] | ||||
السباق الانتخابي
نقد
الانتخابات

الإقبال على الإنتخابات
النتائج
| المرشح الرئاسي | الحزب | الولاية | الصوت الشعبي | الصوت الانتخابي |
Running mate | |||
|---|---|---|---|---|---|---|---|---|
| Count | Pct | Vice-presidential candidate | Home state | Elect. vote | ||||
| باراك اوباما | ديمقراطي | إلينوي | 69,456,897 | 52.92% | 365 | Joe Biden | Delaware | 365 |
| جون مكين | جمهوري | Arizona | 59,934,814 | 45.66% | 173 | Sarah Palin | ألاسكا | 173 |
| Ralph Nader | Independent | Connecticut | 738,475 | 0.56% | 0 | Matt Gonzalez | كاليفورنيا | 0 |
| Bob Barr | Libertarian | Georgia | 523,686 | 0.40% | 0 | Wayne Allyn Root | Nevada | 0 |
| Chuck Baldwin | Constitution | فلوريدا | 199,314 | 0.15% | 0 | Darrell Castle | تنسي | 0 |
| Cynthia McKinney | Green | Georgia | 161,603 | 0.12% | 0 | Rosa Clemente | كارولينا الشمالية | 0 |
| آخرون | 242,539 | 0.18% | — | آخرون | — | |||
| الإجمالي | 131,257,328 | 100% | 538 | 538 | ||||
| المطلوب للفوز | 270 | 270 | ||||||
؛ النتائج حسب الولاية
| الولايات/المقاطعات التي فاز فيها اوباما/بايدن |
| States/districts won by McCain/Palin |
| الولاية | المنتخبون | أصوات اوباما | % | أصوات بايدن | % | أصوات نادر | % | أصوات بار | % | أصوات بادلوين | % | أصوات ماك كيني | % | آخرون | % | اوباما - ماكين | اوباما + ماكين |
|---|---|---|---|---|---|---|---|---|---|---|---|---|---|---|---|---|---|
| Alabama | 9 | 813,479 | 38.74 | 1,266,546 | 60.32 | 6,788 | 0.323 | 4,991 | 0.238 | 4,310 | 0.205 | 3,705 | 0.176 | -21.58 | 99.06 | ||
| Alaska | 3 | 123,594 | 37.89 | 193,841 | 59.42 | 3,783 | 1.16 | 1,589 | 0.487 | 1,660 | 0.509 | 1,730 | 0.530 | -21.54 | 97.31 | ||
| Arizona | 10 | 1,034,707 | 45.12 | 1,230,111 | 53.64 | 11,301 | 0.493 | 12,555 | 0.547 | 1,371 | 0.060 | 3,406 | 0.149 | 24 | 0.001 | -8.52 | 98.75 |
| Arkansas | 6 | 422,310 | 38.86 | 638,017 | 58.72 | 12,882 | 1.19 | 4,776 | 0.440 | 4,023 | 0.370 | 3,470 | 0.319 | 1,139 | 0.105 | -19.85 | 97.58 |
| California | 55 | 8,274,473 | 61.01 | 5,011,781 | 36.95 | 108,381 | 0.799 | 67,582 | 0.498 | 3,145 | 0.023 | 38,774 | 0.286 | 57,764 | 0.426 | 24.06 | 97.97 |
| Colorado | 9 | 1,288,576 | 53.66 | 1,073,589 | 44.71 | 13,350 | 0.556 | 10,897 | 0.454 | 6,233 | 0.260 | 2,822 | 0.118 | 5,894 | 0.245 | 8.95 | 98.37 |
| Connecticut | 7 | 997,772 | 60.59 | 629,428 | 38.22 | 19,162 | 1.16 | 311 | 0.019 | 90 | 0.005 | 29 | 0.002 | 22.37 | 98.81 | ||
| Delaware | 3 | 255,459 | 61.94 | 152,374 | 36.95 | 2,401 | 0.582 | 1,109 | 0.269 | 626 | 0.152 | 385 | 0.093 | 58 | 0.014 | 25.00 | 98.89 |
| District of Columbia | 3 | 245,800 | 92.46 | 17,367 | 6.53 | 958 | 0.360 | 590 | 0.222 | 1,138 | 0.428 | 85.92 | 98.99 | ||||
| Florida | 27 | 4,282,074 | 51.03 | 4,045,624 | 48.22 | 28,124 | 0.335 | 17,218 | 0.205 | 7,915 | 0.094 | 2,887 | 0.034 | 6,902 | 0.082 | 2.82 | 99.25 |
| Georgia | 15 | 1,844,123 | 46.99 | 2,048,759 | 52.20 | 1,158 | 0.030 | 28,731 | 0.732 | 1,402 | 0.036 | 250 | 0.006 | 63 | 0.002 | -5.21 | 99.19 |
| Hawaii | 4 | 325,871 | 71.85 | 120,566 | 26.58 | 3,825 | 0.843 | 1,314 | 0.290 | 1,013 | 0.223 | 979 | 0.216 | 45.26 | 98.43 | ||
| Idaho | 4 | 236,440 | 36.10 | 403,012 | 61.53 | 7,175 | 1.10 | 3,658 | 0.558 | 4,747 | 0.725 | -25.43 | 97.62 | ||||
| Illinois | 21 | 3,419,348 | 61.92 | 2,031,179 | 36.78 | 30,948 | 0.560 | 19,642 | 0.356 | 8,256 | 0.150 | 11,838 | 0.214 | 1,160 | 0.021 | 25.14 | 98.70 |
| Indiana | 11 | 1,374,039 | 49.95 | 1,345,648 | 48.91 | 909 | 0.033 | 29,257 | 1.06 | 1,024 | 0.037 | 87 | 0.003 | 90 | 0.003 | 1.03 | 98.86 |
| Iowa | 7 | 828,940 | 53.93 | 682,379 | 44.39 | 8,014 | 0.521 | 4,590 | 0.299 | 4,445 | 0.289 | 1,423 | 0.093 | 7,332 | 0.477 | 9.53 | 98.32 |
| Kansas | 6 | 514,765 | 41.65 | 699,655 | 56.61 | 10,527 | 0.852 | 6,706 | 0.543 | 4,148 | 0.336 | 35 | 0.003 | 36 | 0.003 | -14.96 | 98.26 |
| Kentucky | 8 | 751,985 | 41.17 | 1,048,462 | 57.40 | 15,378 | 0.842 | 5,989 | 0.328 | 4,694 | 0.257 | -16.23 | 98.57 | ||||
| Louisiana | 9 | 782,989 | 39.93 | 1,148,275 | 58.56 | 6,997 | 0.357 | 2,581 | 0.132 | 9,187 | 0.469 | 10,732 | 0.547 | -18.63 | 98.50 | ||
| Maine | 2* | 421,923 | 57.67 | 295,273 | 40.36 | 10,636 | 1.45 | 251 | 0.034 | 177 | 0.024 | 2,900 | 0.396 | 431 | 0.059 | 17.31 | 98.03 |
| ME 1st Dist. | 1 | 232,145 | 60.51 | 144,604 | 37.69 | 5,263 | 1.37 | 1,362 | 0.355 | 252 | 0.066 | 22.82 | 98.21 | ||||
| ME 2nd Dist. | 1 | 189,778 | 54.61 | 150,669 | 43.35 | 5,373 | 1.55 | 1,538 | 0.443 | 179 | 0.052 | 11.25 | 97.96 | ||||
| Maryland | 10 | 1,629,467 | 61.92 | 959,862 | 36.47 | 14,713 | 0.559 | 9,842 | 0.374 | 3,760 | 0.143 | 4,747 | 0.180 | 9,205 | 0.350 | 25.44 | 98.39 |
| Massachusetts | 12 | 1,904,097 | 61.80 | 1,108,854 | 35.99 | 28,841 | 0.936 | 13,189 | 0.428 | 4,971 | 0.161 | 6,550 | 0.213 | 14,483 | 0.470 | 25.81 | 97.79 |
| Michigan | 17 | 2,872,579 | 57.43 | 2,048,639 | 40.96 | 33,085 | 0.661 | 23,716 | 0.474 | 14,685 | 0.294 | 8,892 | 0.178 | 170 | 0.003 | 16.47 | 98.39 |
| Minnesota | 10 | 1,573,354 | 54.06 | 1,275,409 | 43.82 | 30,152 | 1.04 | 9,174 | 0.315 | 6,787 | 0.233 | 5,174 | 0.178 | 10,319 | 0.355 | 10.24 | 97.88 |
| Mississippi | 6 | 554,662 | 43.00 | 724,597 | 56.18 | 4,011 | 0.311 | 2,529 | 0.196 | 2,551 | 0.198 | 1,034 | 0.080 | 481 | 0.037 | -13.17 | 99.18 |
| Missouri | 11 | 1,441,911 | 49.29 | 1,445,814 | 49.43 | 17,813 | 0.609 | 11,386 | 0.389 | 8,201 | 0.280 | 80 | 0.003 | -0.13 | 98.72 | ||
| Montana | 3 | 231,667 | 47.25 | 242,763 | 49.52 | 3,686 | 0.752 | 1,355 | 0.276 | 143 | 0.029 | 23 | 0.005 | 10,638 | 2.17 | -2.26 | 96.77 |
| Nebraska | 2* | 333,319 | 41.60 | 452,979 | 56.53 | 5,406 | 0.675 | 2,740 | 0.342 | 2,972 | 0.371 | 1,028 | 0.128 | 2,837 | 0.354 | -14.93 | 98.13 |
| NE 1st Dist. | 1 | 121,468 | 44.34 | 148,179 | 54.09 | 1,970 | 0.719 | 929 | 0.339 | 1,019 | 0.372 | 393 | 0.143 | -9.75 | 98.43 | ||
| NE 2nd Dist. | 1 | 138,752 | 49.96 | 135,439 | 48.76 | 1,621 | 0.584 | 1,007 | 0.363 | 604 | 0.217 | 321 | 0.116 | 1.19 | 98.72 | ||
| NE 3rd Dist. | 1 | 73,099 | 29.63 | 169,361 | 68.64 | 1,815 | 0.736 | 804 | 0.326 | 1,349 | 0.547 | 314 | 0.127 | -39.01 | 98.26 | ||
| Nevada | 5 | 533,736 | 55.15 | 412,827 | 42.65 | 6,150 | 0.635 | 4,263 | 0.440 | 3,194 | 0.330 | 1,411 | 0.146 | 6,267 | 0.648 | 12.49 | 97.80 |
| New Hampshire | 4 | 384,826 | 54.13 | 316,534 | 44.52 | 3,503 | 0.493 | 2,217 | 0.312 | 226 | 0.032 | 40 | 0.006 | 3,624 | 0.510 | 9.61 | 98.65 |
| New Jersey | 15 | 2,215,422 | 57.27 | 1,613,207 | 41.70 | 21,298 | 0.551 | 8,441 | 0.218 | 3,956 | 0.102 | 3,636 | 0.094 | 2,277 | 0.059 | 15.57 | 98.98 |
| New Mexico | 5 | 472,422 | 56.91 | 346,832 | 41.78 | 5,327 | 0.642 | 2,428 | 0.292 | 1,597 | 0.192 | 1,552 | 0.187 | 15.13 | 98.69 | ||
| New York | 31 | 4,804,701 | 62.88 | 2,752,728 | 36.03 | 41,248 | 0.540 | 19,595 | 0.256 | 634 | 0.008 | 12,801 | 0.168 | 8,936 | 0.117 | 26.86 | 98.91 |
| North Carolina | 15 | 2,142,651 | 49.69 | 2,128,474 | 49.36 | 1,448 | 0.034 | 25,722 | 0.596 | 158 | 0.004 | 13,942 | 0.323 | 0.33 | 99.04 | ||
| North Dakota | 3 | 141,278 | 44.62 | 168,601 | 53.25 | 4,189 | 1.32 | 1,354 | 0.428 | 1,199 | 0.379 | -8.63 | 97.87 | ||||
| Ohio | 20 | 2,940,044 | 51.50 | 2,677,820 | 46.91 | 42,337 | 0.742 | 19,917 | 0.349 | 12,565 | 0.220 | 8,518 | 0.149 | 7,149 | 0.125 | 4.59 | 98.41 |
| Oklahoma | 7 | 502,496 | 34.35 | 960,165 | 65.65 | -31.29 | 100.00 | ||||||||||
| Oregon | 7 | 1,037,291 | 56.75 | 738,475 | 40.40 | 18,614 | 1.02 | 7,635 | 0.418 | 7,693 | 0.421 | 4,543 | 0.249 | 13,613 | 0.745 | 16.35 | 97.15 |
| Pennsylvania | 21 | 3,276,363 | 54.64 | 2,655,885 | 44.29 | 42,977 | 0.717 | 19,912 | 0.332 | 1,092 | 0.018 | 10.35 | 98.93 | ||||
| Rhode Island | 4 | 296,571 | 63.13 | 165,391 | 35.21 | 4,829 | 1.03 | 1,382 | 0.294 | 675 | 0.144 | 797 | 0.170 | 122 | 0.026 | 27.92 | 98.34 |
| South Carolina | 8 | 862,449 | 44.90 | 1,034,896 | 53.87 | 5,053 | 0.263 | 7,283 | 0.379 | 6,827 | 0.355 | 4,461 | 0.232 | -8.98 | 98.77 | ||
| South Dakota | 3 | 170,924 | 44.75 | 203,054 | 53.16 | 4,267 | 1.12 | 1,835 | 0.480 | 1,895 | 0.496 | -8.41 | 97.91 | ||||
| Tennessee | 11 | 1,087,437 | 41.83 | 1,479,178 | 56.90 | 11,560 | 0.445 | 8,547 | 0.329 | 8,191 | 0.315 | 2,499 | 0.096 | 2,337 | 0.090 | -15.07 | 98.73 |
| Texas | 34 | 3,528,633 | 43.68 | 4,479,328 | 55.45 | 5,440 | 0.067 | 56,116 | 0.695 | 5,395 | 0.067 | 831 | 0.010 | 2,781 | 0.034 | -11.77 | 99.13 |
| Utah | 5 | 327,670 | 34.41 | 596,030 | 62.58 | 8,416 | 0.884 | 6,966 | 0.731 | 12,012 | 1.26 | 982 | 0.103 | 294 | 0.031 | -28.18 | 96.99 |
| Vermont | 3 | 219,262 | 67.44 | 98,974 | 30.44 | 3,339 | 1.03 | 1,067 | 0.328 | 500 | 0.154 | 66 | 0.020 | 1,904 | 0.586 | 37.00 | 97.89 |
| Virginia | 13 | 1,959,532 | 52.63 | 1,725,005 | 46.33 | 11,483 | 0.308 | 11,067 | 0.297 | 7,474 | 0.201 | 2,344 | 0.063 | 6,355 | 0.171 | 6.30 | 98.96 |
| Washington | 11 | 1,750,848 | 57.65 | 1,229,216 | 40.48 | 29,489 | 0.971 | 12,728 | 0.419 | 9,432 | 0.311 | 3,819 | 0.126 | 1,346 | 0.044 | 17.18 | 98.13 |
| West Virginia | 5 | 303,857 | 42.59 | 397,466 | 55.71 | 7,219 | 1.01 | 2,465 | 0.346 | 2,355 | 0.330 | 89 | 0.012 | -13.12 | 98.30 | ||
| Wisconsin | 10 | 1,677,211 | 56.22 | 1,262,393 | 42.31 | 17,605 | 0.590 | 8,858 | 0.297 | 5,072 | 0.170 | 4,216 | 0.141 | 8,062 | 0.270 | 13.90 | 98.53 |
| Wyoming | 3 | 82,868 | 32.54 | 164,958 | 64.78 | 2,525 | 0.992 | 1,594 | 0.626 | 1,192 | 0.468 | 1,521 | 0.597 | -32.24 | 97.32 | ||
| U.S. Total | 538 | 69,498,215 | 52.93 | 59,948,240 | 45.66 | 738,720 | 0.563 | 523,713 | 0.399 | 199,437 | 0.152 | 161,680 | 0.123 | 226,979 | 0.173 | 7.27 | 98.59 |
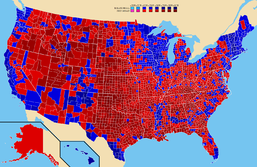
Popular vote by county. Red represents counties that went for McCain, Blue represents counties that went for Obama. Connecticut, Hawaii, Massachusetts, New Hampshire, Rhode Island, and Vermont had all counties go to Obama. Oklahoma had all counties go to McCain.
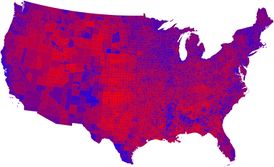
Presidential popular votes by county as a scale from red/Republican to blue/Democratic.
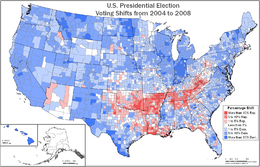
Voting shifts per county from the 2004 to the 2008 election. Darker blue indicates the county voted more Democratic. Darker red indicates the county voted more Republican.


![Cartogram of popular vote with each county rescaled in proportion to its population. Deeper blue represents a Democratic majority, brighter red represents a Republican majority.[3]](/%D9%85%D9%84%D9%81:2008CartogramElection.jpg)

. . . . . . . . . . . . . . . . . . . . . . . . . . . . . . . . . . . . . . . . . . . . . . . . . . . . . . . . . . . . . . . . . . . . . . . . . . . . . . . . . . . . . . . . . . . . . . . . . . . . . . . . . . . . . . . . . . . . . . . . . . . . . . . . . . . . . . . . . . . . . . . . . . . . . . . . . . . . . . . . . . . . . . . .
المقاطعات/الولايات القريبة

States/districts where the margin of victory was under 5% (88 electoral votes):
- Missouri 0.14%
- North Carolina 0.32%
- Indiana 1.04%
- Nebraska's 2nd congressional district 1.19%
- Montana 2.25%
- Florida 2.82%
- Ohio 4.59%
States/districts where margin of victory was more than 5% but less than 10% (64 electoral votes):
- Georgia 5.21%
- Virginia 6.29%
- South Dakota 8.41%
- Arizona 8.52%
- North Dakota 8.63%
- Colorado 8.95%
- South Carolina 8.97%
- Iowa 9.54%
- New Hampshire 9.65%
- Pennsylvania 9.69%
- Nebraska's 1st congressional district 9.77%
ردود الفعل الدولية
تحليل

انظر أيضا
المصادر
- ^ أ ب ت ث http://www.fec.gov/pubrec/fe2008/2008presgeresults.pdf
- ^ "Financial Summary Report Search Results". fec.gov. Retrieved December 22, 2008.
- ^ http://www-personal.umich.edu/~mejn/election/2008/
قراءات إضافية
- Plouffe, David. The Audacity to Win. 2009
- Balz, Dan, and Haynes Johnson. The Battle for America 2008: The Story of an Extraordinary Election (2009), by leading reporters with inside information
- Crotty, William. "Policy and Politics: The Bush Administration and the 2008 Presidential Election," Polity, July 2009, Vol. 41 Issue 3, pp 282–311
- Curtis, Mark. Age of Obama: A Reporter's Journey With Clinton, McCain and Obama in the Making of the President in 2008 (2009)
- Nelson, Michael. The Elections of 2008 (2009), factual summary except and text search
- Sussman, Glen. "Choosing a New Direction: The Presidential Election of 2008," White House Studies, 2009, Vol. 9 Issue 1, pp 1–20
- Wolffe, Richard. Renegade: The Making of a President (2010) excerpt and text search, narrative
الناخبون
- Abramson, Paul R., John H. Aldrich, and David W. Rohde. Change and Continuity in the 2008 Elections (2009) excerpt and text search
- Corwin E. Smidt and others. The Disappearing God Gap? Religion in the 2008 Presidential Election (Oxford University Press; 2010) 278 pages. Finds that the gap between church-attending traditionalists and other voters is not closing, as has been claimed, but is changing in significant ways; draws on survey data from voters who were interviewed in the spring of 2008 and then again after the election.
- Crespino, Joseph. "The U.S. South and the 2008 Election," Southern Spaces (2008) online
- Jessee, Stephen A. "Voter Ideology and Candidate Positioning in the 2008 Presidential Election," American Politics Research, March 2010, Vol. 38 Issue 2, pp 195–210
- Kenski, Kate, Bruce W. Hardy, and Kathleen Hall Jamieson. The Obama Victory: How Media, Money, and Message Shaped the 2008 Election (Oxford University Press; 2010) 378 pages. Draws on interviews with key campaign advisors as well as the National Annenberg Election Survey. excerpt and text search
- Sabato, Larry. The Year of Obama: How Barack Obama Won the White House (2009)
- Todd, Chuck, and Sheldon Gawiser. How Barack Obama Won: A State-by-State Guide to the Historic 2008 Presidential Election (2009) excerpt and text search
وصلات خارجية
- الانتخابات الرئاسية الأمريكية 2008 at the Open Directory Project
- Beyond Red and Blue: 7 Ways to View the Presidential Election Map—from Scientific American
- Campaign commercials from the 2008 election
- How close was the 2008 election?—Michael Sheppard, Massachusetts Institute of Technology
- US Election 2008 Web Monitor
- 2008 Electoral Map
- "Behind the Results", USA Today election coverage
- Joseph Crespino, "The U.S. South and the 2008 Election", Southern Spaces, December 11, 2008.